v3 adds a “spatial economy” proxy to the v2 complexity score. Its factors reward used empty space, localized coupling, episodic bonds, and persistent phenotype diversity. They do not directly test regional chemical composition.
| factor | measured quantity |
|---|---|
t9 · traversal | Void-fraction trapezoid (knots 0.35, 0.55, 0.99, 0.9975) × median displacement-through-void score, gated by void percolation. Full displacement credit at 3 blob radii per 100 tu. |
s9 · surface locality | Share of coupling-term flux inside the
organism-support boundary shell (SHELL_PX=2 in the implementation).
Requires full-field snapshots. |
e9 · episodic encounters | Bond-lifetime mass in the 10–500 tu band /
total bond mass, multiplied by (1 − frozen-pair fraction) and
min(total bond mass / 2000 tu, 1). “Frozen” means bonded for >80% of the window. |
r9 · diversity | clip(log₂(n_eff)/log₂(24), 0, 1) × (1 − takeover).
Here n_eff = exp(entropy) over d7b phenotype clusters with ≥500 tu time coverage.
These clusters are not regional compartments. |
Any measured zero factor makes C9 zero; the alive gate also rejects dead worlds.
I_v2 is the preserved 0–100 v2 score.
Metric definitions and constants give the exact implementation.
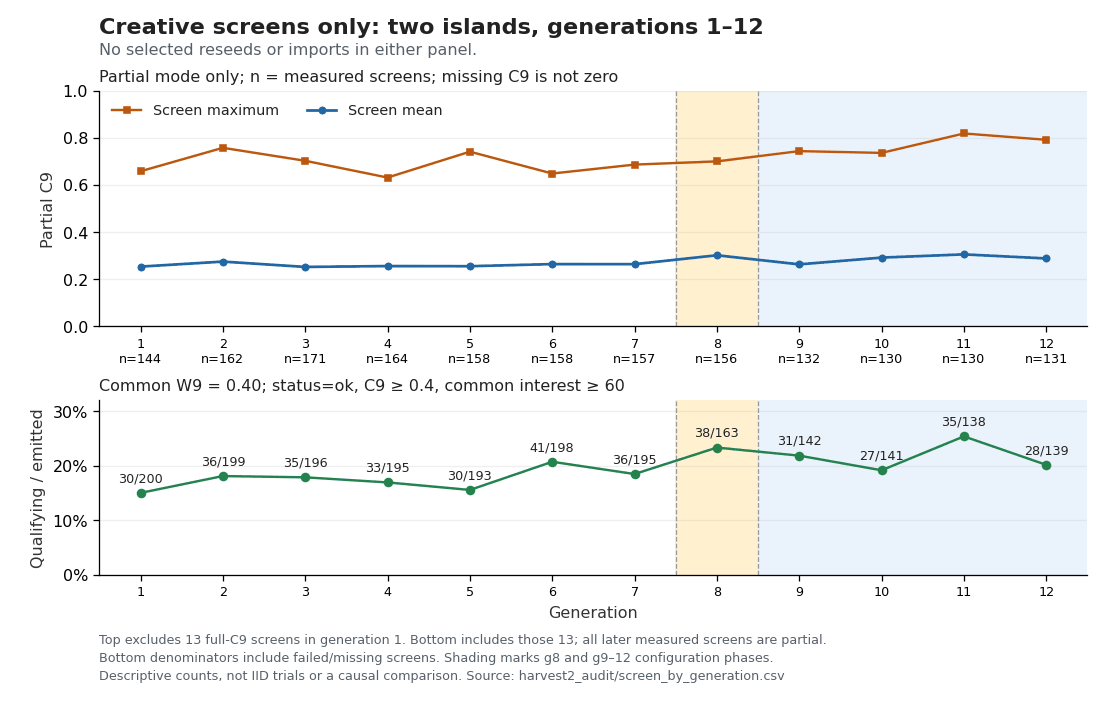
Partial and full C9 are different assays. The continuation
measured partial C9 only: surface locality was not measured. The baseline includes
13 full-C9 creative screens in generation 1, so its C9 statistics are split below.
Six full-C9 atlas imports are outside the creative-screen comparison. Missing C9
is not zero. Partial C9 can earn the structured descriptor, but cannot
satisfy the full-s9 economy class rule.
Unless marked otherwise, qualification means status=ok,
C9 ≥ 0.4, and common interest ≥ 60 at W9 = 0.40.
The audit applies the same blend to preserved measurements; it does not rerun
metrics or compare raw scores made with different weights. “Qualifying” is not
a test for biological cells or the strict economy class.
| quantity | baseline g1–7 | continuation g8–12 |
|---|---|---|
| Qualifying / all emitted screens | 241 / 1,376 (17.5%) 237 partial + 4 full | 159 / 723 (22.0%) all partial |
| Measured partial C9: n · mean · max | 1,114 · 0.2599 · 0.7576 | 679 · 0.2903 · 0.8185 |
| Measured full C9: n · mean · max | 13 · 0.4487 · 0.6979 | none measured |
| cohort | same-genome assay rows | measured partial C9 n | mean C9 | max C9 | qualifying at W9 .40 |
|---|---|---|---|---|---|
| g1–7 | 931 | 930 | 0.2619 | 0.8504 | 200 / 931 |
| g8–12 | 389 | 389 | 0.2172 | 0.8895 | 74 / 389 |
The best selected assay is p1g12_049_s3, an add_chan
child on island 1. Its genotype scored 0.6737 / 0.8854 / 0.8895 in the
screen / seed-2 / seed-3 observations. The aggregate selected-reseed mean fell,
and island 2's best selected C9 remains the older 0.8048 result. A higher maximum
is not uniform improvement or a guarantee on a new seed.
Count each exact MAP-Elites descriptor key once if at least one creative screen qualifies at common W9 = 0.40. The baseline observed 51 bins (48 restricted to partial C9); the continuation observed 45 (all partial), including 14 new relative to the baseline. Their union is 65 (62 using partial C9 only). These are observed behavior categories across runs, not physical cells, verified archive incumbents, or compartment counts. The earlier 76 was a pooled screen-plus-selected-reseed bin count at W9 = 0.25, not archive occupancy.
Two islands searched from the v2 archive with a spatial-class descriptor axis. The following are requested creative slots per island per generation, not emitted counts or a nominal population size.
| phase | W9 | total slots | SIC slots / retries per target | mutate | mint_bilin |
|---|---|---|---|---|---|
| g1–7 | 0.25 | 100 | 8 / pilot generator | 16 | 12 |
| g8 | 0.40 | 93 | 24 / 60 | 16 | 16 |
| g9–12 | 0.40 | 89 | 12 / 12 | 22 | 18 |
merge_spatial_ic (SIC) keeps one parent's chemistry and composes
two parents' developed fields into soft-masked spatial regions as the initial
condition. It does not create region-specific chemistry. Confirmation jobs
omit that composed IC and start from soup.
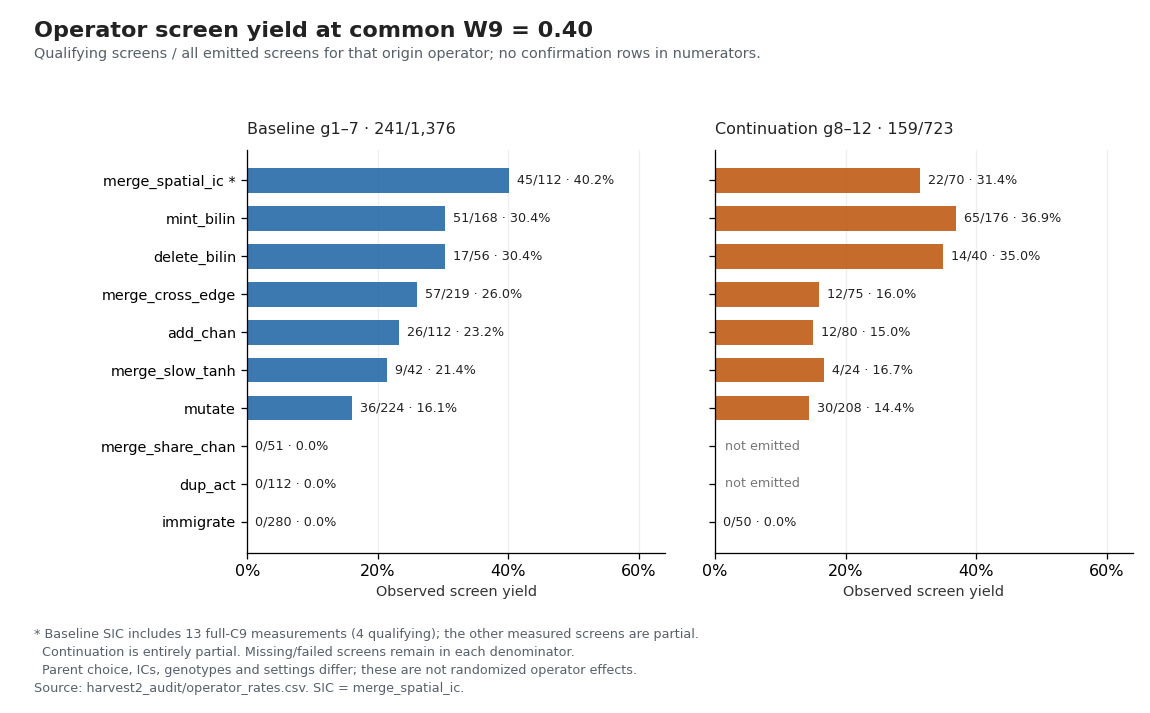
For the historical W9 = 0.25 comparison, SIC's direct screen yield was 52/112 = 0.4643. The old 0.82 was (52 screens + 40 selected-confirmation observations) / 112 screen lanes: 92 observations in the numerator, not a hit probability. Counting each of the 112 bases once, 23 had at least one qualifying same-genome confirmation, whether or not its screen qualified; 12 passed the threshold in all three assays (11 partial-only). Those assays did not replicate the composed spatial phenotype.
These are descriptive operator yields. Weight, operator mix, retry limits, and parent archive changed together. There is no causal W9 or SIC comparison, and an unchanged-configuration continuation was not tested.
These are not the original measured trajectories or score reconfirmations. All six captured requests match their actual result-row and job genomes and are outside the 11 anomalous links (identity checks). The C9 labels below belong to the original assays. Replays regenerate soup initial conditions; runtime and numerical-path differences can change trajectories.
p1g12_049_s2add_chan · seed 958 · T = 20,000 tu.p1g12_007_s3mutate · seed 959 · T = 20,000 tu.p1g1_009_s3mutate · seed 959 · T = 10,000 tu.p2g6_032_s2add_chan · seed 965 · T = 20,000 tu.p2g11_036mint_bilin · seed 964 · T = 10,000 tu.p2g1_025_s2mint_bilin · seed 965 · T = 20,000 tu.Do not start another campaign until identity and the intended measure are validated.
The h9 review found that v0 is a fixed-grid label-association diagnostic, not a compartment-phenotype ranker. Its toy counterexamples can reward identical compositions or lose separation under translation. Do not add v0 to C9, choose a biological cutoff, or scan the full harvest to hunt for one. The next step is identity safeguards and measure validation, not a larger search justified by a proxy maximum.